This article provides a quick hands-on for Kubernetes's Horizontal Pod Autoscaler (HPA). It deploys a simple CPU-intensive Web app on Kubernetes, and configures the HPA for the deployment. Then, we perform load testing to verify that the number of replicas scale automatically based on the metrics we configure.
Tested Environment
- MacBook Pro 2021 (M1 Pro) 32GB
- Kubernetes v1.26.4 on Rancher Desktop v1.8.1 using VM with 4 CPUs and 12 GB memory
Overview
- Create a simple Go application
- Dockerize the Go application
- Deploy the application on Kubernetes
- Configure the HPA
- Establish port-forwarding for the Go application
- Test using k6 load tester
GitHub repo is available here
Step 1. Create a Simple Go App
First, we'll create a simple CPU-intensive Go application using the Gin framework:
package main

import (
	"fmt"
	"math"
	"math/rand"
	"net/http"

	"github.com/gin-gonic/gin"
)

func cpu_intensive(rnd int) float64 {
	f := 0.
	for i := 0; i < 10_000*rnd; i++ {
		f += math.Sqrt(float64(i))
	}
	return f
}

func main() {
	r := gin.Default()
	r.GET("/", func(c *gin.Context) {
		_rnd := rand.Intn(1000)
		f := cpu_intensive(_rnd)
		ret := fmt.Sprintf("%d: %.2f", _rnd, f)
		c.String(http.StatusOK, ret)
	})
	r.Run(":8080")
}
The above program accepts GET / on port 8080 and performs sqrt for varying time period.
Step 2: Dockerize the Go App
Next, we'll create a Dockerfile to containerize our Go application:
FROM golang:alpine AS builder
WORKDIR /src
COPY . /src
RUN CGO_ENABLED=0 go build -o app

FROM scratch
COPY --from=builder /src/app /app
EXPOSE 8080
ENTRYPOINT ["/app"]
I have built this image targeting both linux/amd64 and linux/arm64, and uploaded it to ryojpn/go-cpu-intensive on DockerHub.
Step 3: Deploy the Application on Kubernetes
Now we'll create a Kubernetes deployment:
apiVersion: apps/v1
kind: Deployment
metadata:
  name: go-cpu-intensive
  labels:
    app: go-cpu-intensive
spec:
  replicas: 1
  selector:
    matchLabels:
      app: go-cpu-intensive
  template:
    metadata:
      labels:
        app: go-cpu-intensive
    spec:
      containers:
        - name: go-cpu-intensive
          image: ryojpn/go-cpu-intensive
          resources:
            limits:
              cpu: 1000m
              memory: 500Mi
            requests:
              cpu: 500m
              memory: 250Mi
          ports:
            - containerPort: 8080
Now, let's apply the deployment:
kubectl apply -f k8s
Step 4: Configure the HPA
We can set up the HPA to scale the number of pod replicas based on CPU utilization:
apiVersion: autoscaling/v2
kind: HorizontalPodAutoscaler
metadata:
  name: go-cpu-intensive
spec:
  scaleTargetRef:
    apiVersion: apps/v1
    kind: Deployment
    name: go-cpu-intensive
  minReplicas: 1
  maxReplicas: 10
  metrics:
  - type: Resource
    resource:
      name: cpu
      target:
        type: Utilization
        averageUtilization: 50
Now, let's apply the HPA:
kubectl apply -f k8s
Step 5: Establish Port-Forwarding for the Go App
Open your terminal and run:
kubectl get po
Copy the pod name for your go-cpu-intensive deployment.
Then, establish the port-forwarding on 8080:
kubectl port-forward go-cpu-intensive-54449f89d-rg4qz 8080:8080
Please make sure to replace the pod name appropriately.
Step 6: Test using k6 Load Tester
Install k6 load testing tool on your machine and create a test file:
import http from "k6/http";
import { check, sleep } from "k6";

export const options = {
  stages: [
    { duration: "1m", target: 100 },
    { duration: "1m", target: 200 },
    { duration: "3m", target: 800 },
    { duration: "1m", target: 900 },
    { duration: "2m", target: 500 },
    { duration: "2m", target: 200 },
  ],
};

export default function () {
  const res = http.get("http://localhost:8080/");
  check(res, {
    "status was 200": (r) => r.status == 200,
  });
  sleep(1);
}
Then, please open two terminal windows.
On one terminal, we will watch the changes in the number of replicas based on the pre-defined metric target, CPU utilization:
kubectl get hpa -w
On the other terminal, we will run the k6 load test with a high number of virtual users to simulate heavy load:
k6 run loadtest.js
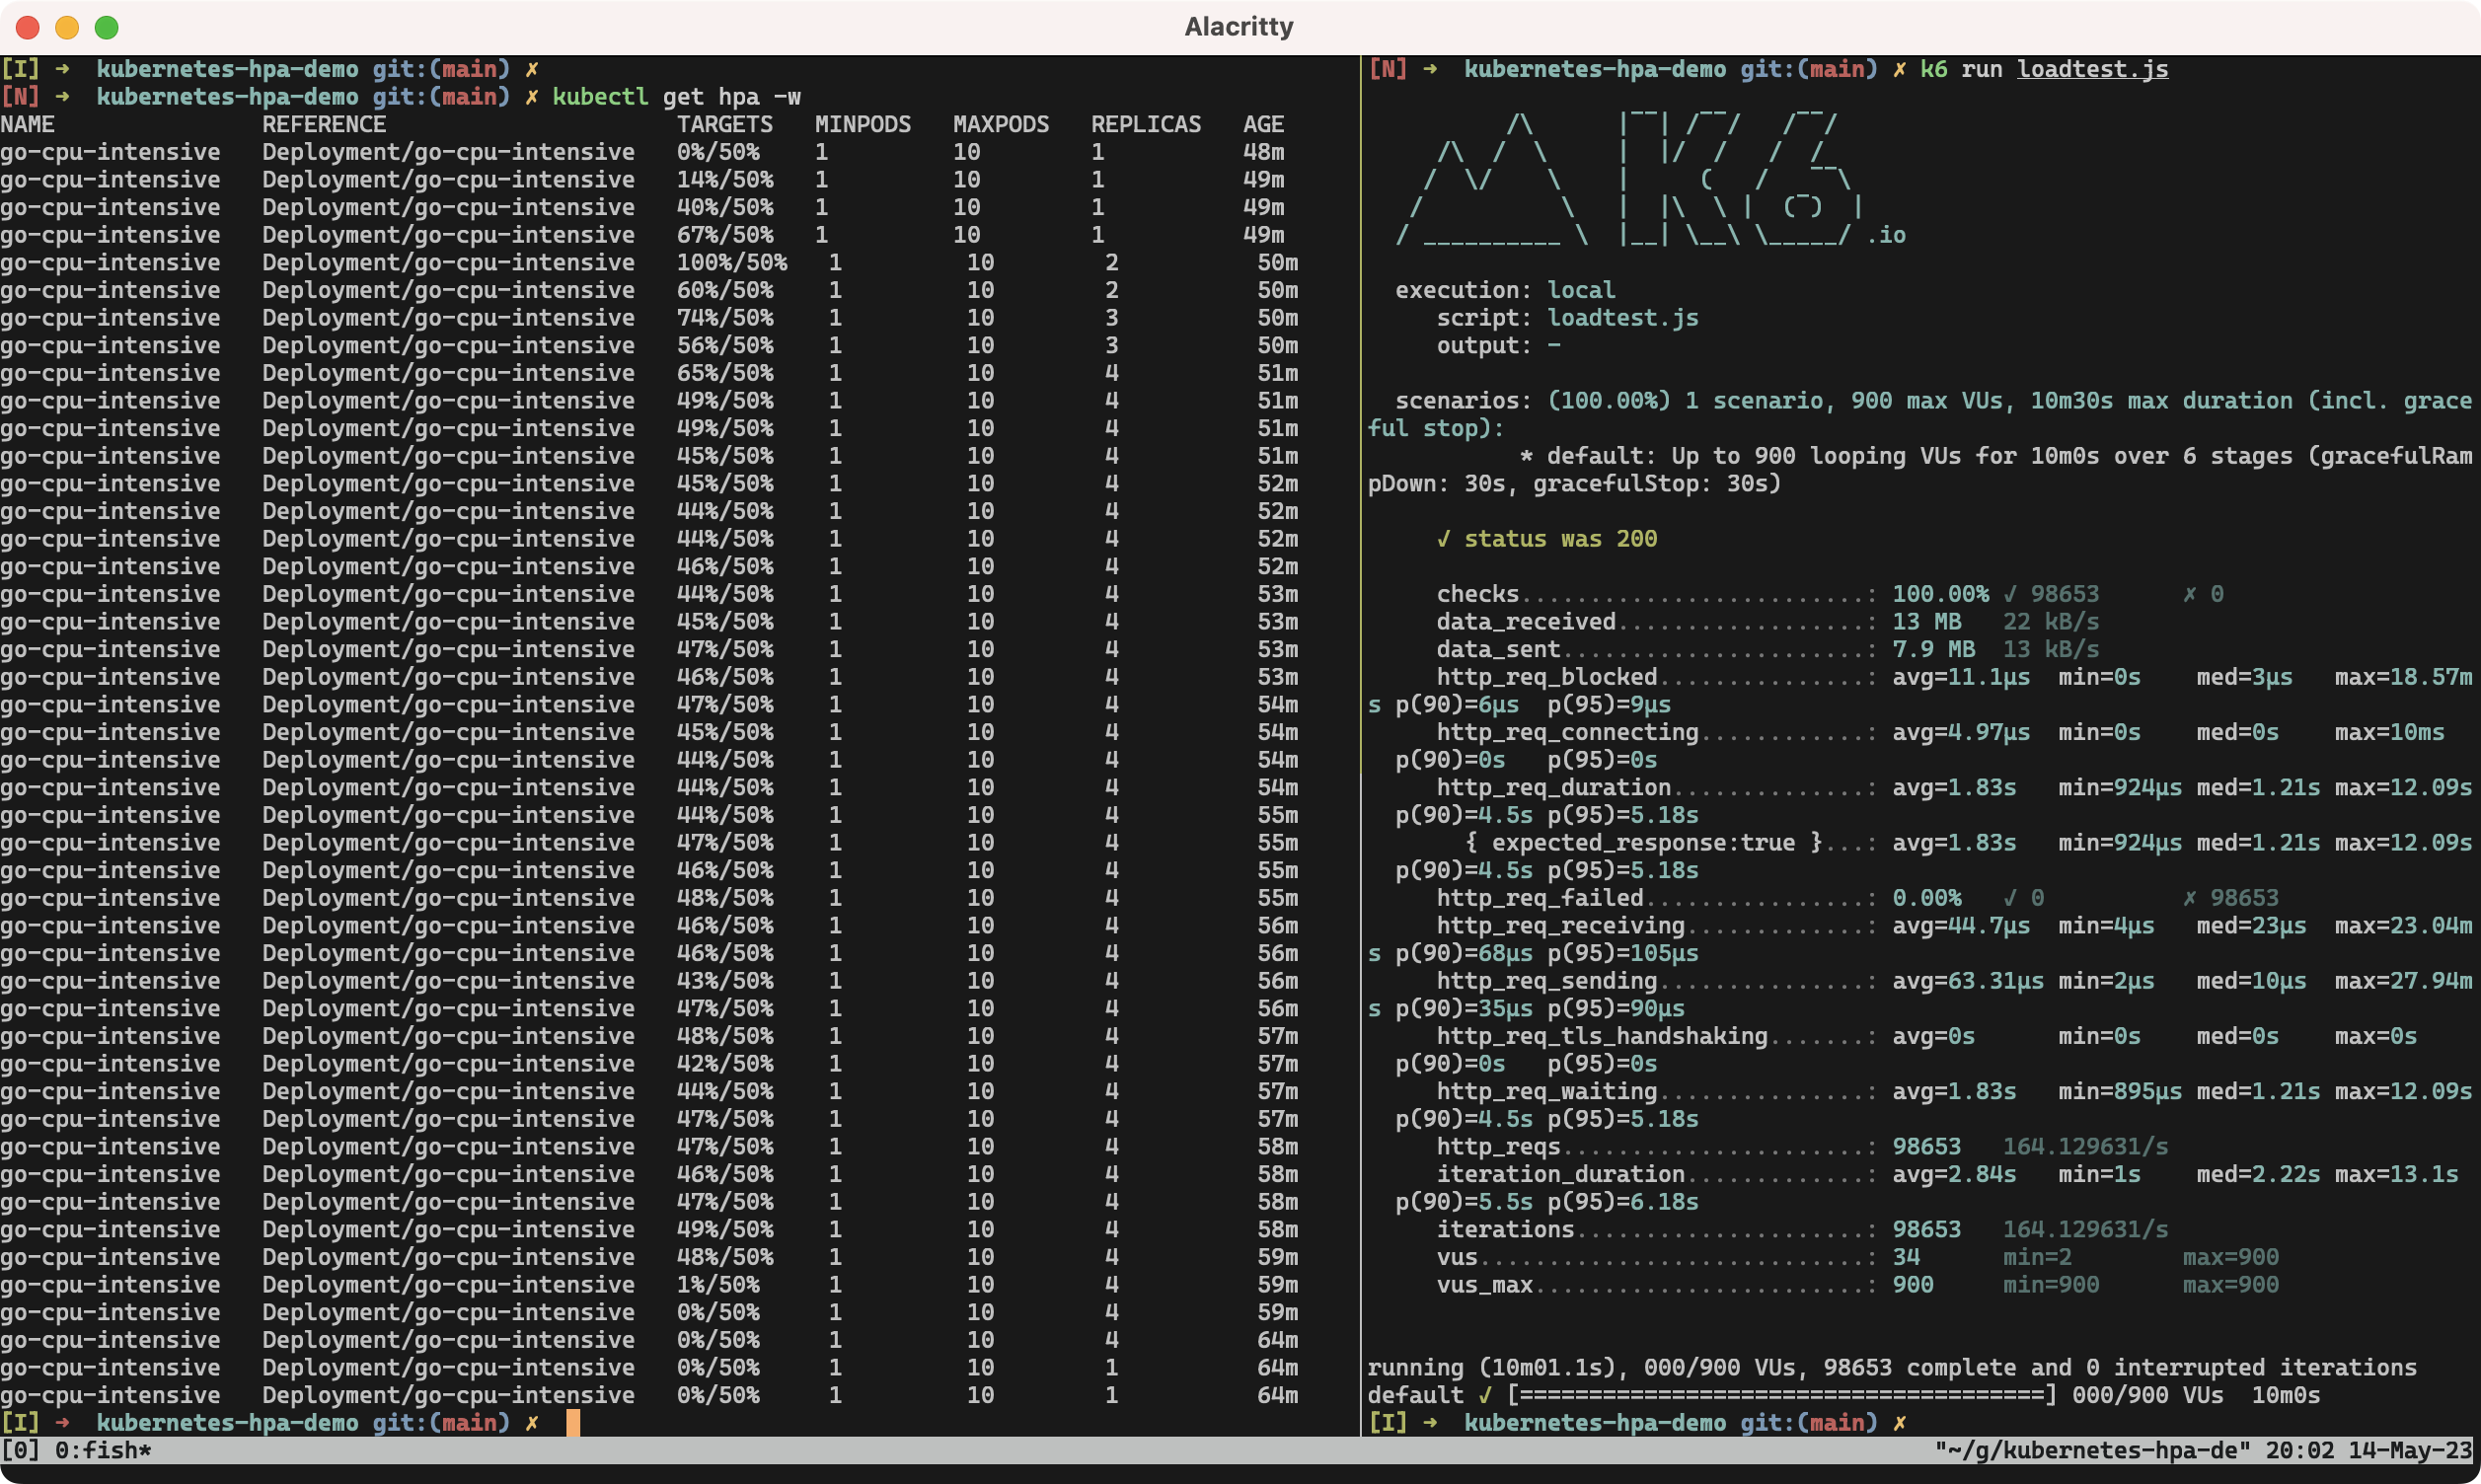
Below is the screenshot I took:

As you can see, although the CPU utilization metric exceeds up to 100% in the beginning, as the replicas scale to four, the metric stabilizes at around 45%. After the load test finishes, it takes some minutes (five minutes by default) to start scaling in. This time period can also be configured if you want to.
Final Thoughts
The above demo used CPU utilization as the target metrics. However, we observed that the HPA cannot always keep the number of replicas to meet the metric target. In case the increase of the number of requests is somewhat predictable, you should perhaps set the number of replicas manually and let HPA adjust it.
With Prometheus Adapter, various metrics other than CPU/memory utilization can be used for autoscaling. My next interest includes fetching HTTP response time and using it as one of the autoscaling metrics.
