
In a previous article, I demonstrated the Horizontal Pod Autoscaler (HPA) of Kubernetes. In that article, I set up autoscaling for CPU utilization, but this time I will set the HPA target to the request processing time of the pod in question. Since it is time-consuming to manage metrics values on the application side, I will get the request processing time metrics from the service mesh Istio.
The big picture
I found a very clear diagram in Medium article by Stefan Prodan:
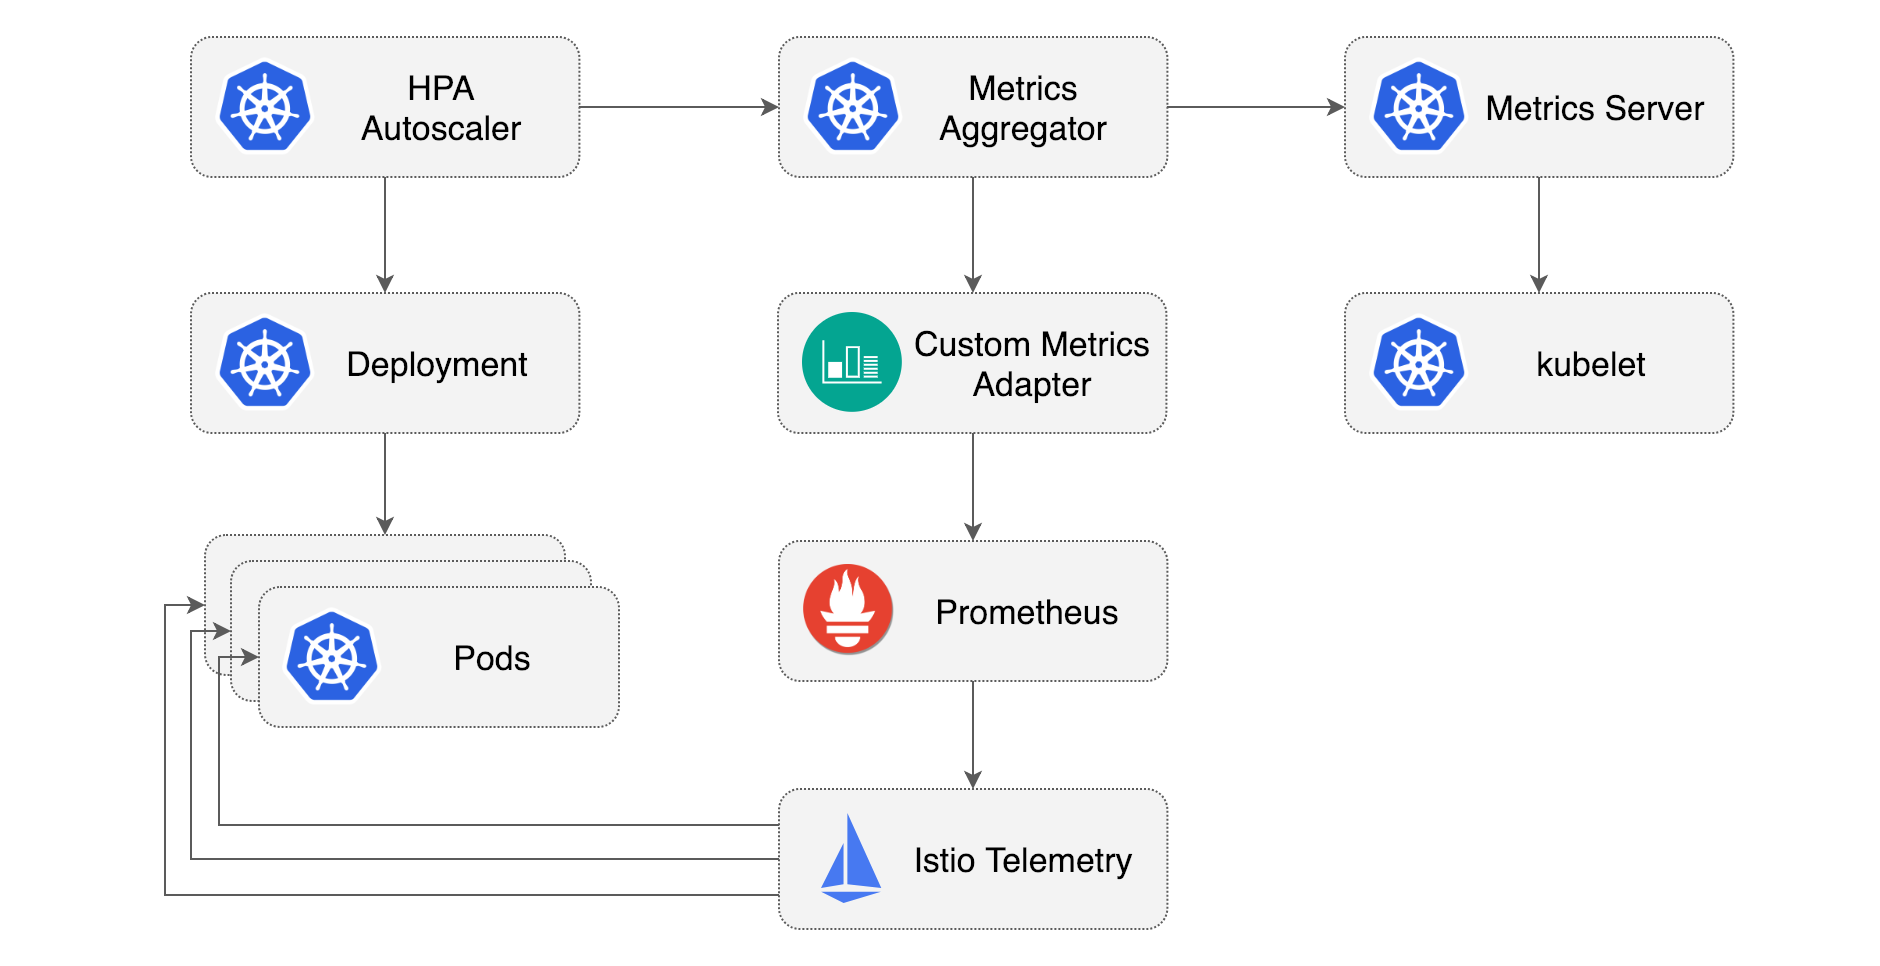
The HPA with CPU metrics configured in previous article can be found in the upper right corner of the Metrics Server to get the metrics values. HoIver, the Metrics Server is, as written in the README, only applicable to
- HPA for CPU and memory utilization, or
- VPA (vertical pod autoscaling)
Therefore, in this article, metrics obtained from Istio via Prometheus will be used in Prometheus Adapter to the Kubernetes Custom Metrics API and use them as target metrics for the HPA.
Workload and architecture
As workload, I will use the Go application also used in previous article (GitHub and DockerHub).
It is a simple program that performs a random number of sqrt on a GET / request and returns the result.
The Kubernetes architecture is as follows. It may seem overkill to introduce Istio since it has a single workload, but I hope you can think of it as actually part of a larger Kubernetes cluster.

1. Deploy Istio and Telemetry Addons
Deploy Istio using Istioctl:
istioctl install --set profile=demo -y
Then, clone istio/istio and deploy Istio's telemetry addons following the README:
git clone https://github.com/istio/istio.git
cp -r istio/samples/addons .
rm -rf istio
kubectl apply -f addons/
Verify that Prometheus etc. are deployed on the namespace istio-system:
kubectl -n istio-system get all
2. Deploy Prometheus Adapter
Prometheus Adapter is deployable via Helm, but we hope to add the configured metrics in our version management, so we'll use helmfile. Please refer here for installation.
Let's create helmfile.yaml.
Please note that you will need to use -f option for the later helmfile sync command to specify the file you create, if you wish to change the filename to e.g., helmfile.yml.
repositories:
- name: prometheus-community
  url: https://prometheus-community.github.io/helm-charts

releases:
- name: prometheus-adapter
  namespace: monitoring
  chart: prometheus-community/prometheus-adapter
  version: 4.2.0
  values:
  - ./prometheus-adapter-values.yml
Next, let's create prometheus-adapter-values.yml:
prometheus:
  url: http://prometheus.istio-system.svc.cluster.local
  port: 9090

rules:
  custom:
  - seriesQuery: 'istio_requests_total{reporter="destination", destination_service_namespace="demo", destination_service_name="go-cpu-intensive"}'
    resources:
      overrides:
        destination_service_namespace:
          resource: "namespace"
        destination_service_name:
          resource: "service"
    name:
      as: "requests_per_second"
    metricsQuery: 'sum(rate(<<.Series>>{<<.LabelMatchers>>, reporter="destination"}[5m])) by (<<.GroupBy>>)'

  - seriesQuery: 'istio_request_duration_milliseconds_bucket{reporter="destination", destination_workload_namespace="demo", destination_workload="go-cpu-intensive"}'
    resources:
      overrides:
        destination_workload_namespace:
          resource: "namespace"
        destination_workload:
          resource: "deployment"
    name:
      as: "request_duration_seconds_90ile"
    metricsQuery: 'sum(histogram_quantile(0.90, sum(irate(<<.Series>>{<<.LabelMatchers>>, reporter="destination"}[5m])) by (le,<<.GroupBy>>))) by (<<.GroupBy>>) / 1000'
-
prometheus: This section configures Prometheus.- Prometheus deployed as the Istio addon runs on
istio-systemnamespace by default, so using this URL.
- Prometheus deployed as the Istio addon runs on
-
rules.custom: This configures the list of mtrics to export to Kubernetes Custom Metircs API (custom.metrics.k8s.io).
Regarding the first metric,
seriesQuery: This is the query to select a time series for your custom metric.resources: Here, we mapdestination_service_namespacetonamespace, anddestination_service_nametoservice.name: We name the metric asrequests_per_second.metricsQuery:LabelMatchersis the content ofresourcesi.e.,destination_service_namespace="demo",destination_service_name="go-cpu-intensiveGroupByisdestination_service_namespace,destination_service_name(Reference (ja))。
Regarding the second metric, I mapped it to Deployment instead of Service for demonstration purpose.
Let's deploy Prometheus Adapter we configured.
helmfile sync
helmfile loads helmfile.yaml by default, so it should be deployed now.
3. Configuring HPA
The third step is to configure Deployment, Service, and HPA for our workload.
To use Istio's sidecar injection we need to add istio-injection=enabled label to the demo namespace.
apiVersion: v1
kind: Namespace
metadata:
  name: demo
  labels:
    istio-injection: enabled
---
apiVersion: v1
kind: Service
metadata:
  name: go-cpu-intensive
  namespace: demo
  labels:
    app: go-cpu-intensive
spec:
  type: ClusterIP
  selector:
    app: go-cpu-intensive
  ports:
  - port: 80
    targetPort: 8080
---
apiVersion: apps/v1
kind: Deployment
metadata:
  name: go-cpu-intensive
  namespace: demo
  labels:
    app: go-cpu-intensive
spec:
  replicas: 1
  selector:
    matchLabels:
      app: go-cpu-intensive
  template:
    metadata:
      labels:
        app: go-cpu-intensive
    spec:
      containers:
      - name: go-cpu-intensive
        image: ryojpn/go-cpu-intensive
        resources:
          limits:
            cpu: 500m
            memory: 128Mi
          requests:
            cpu: 500m
            memory: 128Mi
        ports:
        - containerPort: 8080
---
apiVersion: autoscaling/v2
kind: HorizontalPodAutoscaler
metadata:
  name: go-cpu-intensive
  namespace: demo
spec:
  scaleTargetRef:
    apiVersion: apps/v1
    kind: Deployment
    name: go-cpu-intensive
  minReplicas: 1
  maxReplicas: 10
  behavior:
  scaleDown:
    stabilizationWindowSeconds: 60 # intentionally using a small value. default: 300
  metrics:
  - type: Object
    object:
      describedObject:
        apiVersion: v1
        kind: Service
        name: go-cpu-intensive
      metric:
        name: requests_per_second
      target:
        type: AverageValue # divide metric value by the number of pods
        averageValue: "50"
  - type: Object
    object:
      describedObject:
        apiVersion: apps/v1
        kind: Deployment
        name: go-cpu-intensive
      metric:
        name: request_duration_seconds_90ile
      target:
        type: Value
        value: 300m
Given that you have a basic understanding of Service and Deployment, I briefly explain HPA manifest.
We mapped two custom metrics to Service and Deployment each, so we set metrics type to Object and configure the target in describedObject.
For target.type, I'd like to take an average per Pod for requests_per_pod, so I use AverageValue.
For value of request_duration_seconds_90ile, the manifest reads 300m, but "0.3" (string type) means the same thing.
Now, let's deploy those:
kubectl apply -f go-cpu-intensive.yml
4. Configuring Istio Ingress Gateway
To collect metrics using Istio, requests from the Internet must first be accepted by Ingress Gateway.
So we generate a Gateway and a VirtualService with the following manifest.
apiVersion: networking.istio.io/v1beta1
kind: Gateway
metadata:
  namespace: demo
  name: demo-gateway
spec:
  selector:
    istio: ingressgateway # use istio default controller
  servers:
  - port:
      number: 80
      name: http
      protocol: HTTP
    hosts:
    - '*'
---
apiVersion: networking.istio.io/v1beta1
kind: VirtualService
metadata:
  namespace: demo
  name: istio-ingress-vs
spec:
  hosts:
    - '*'
  gateways:
    - demo-gateway
  http:
    - route:
        - destination:
            host: go-cpu-intensive.demo.svc.cluster.local
            port:
              number: 80
Let's deploy them:
kubectl apply -f istio-gateway.yml
In my environment (MicroK8s), I see that Istio's Ingress Gateway is not assigned an External IP and port 80 is mapped to localhost:30341:
$ kubectl -n istio-system get svc/istio-ingressgateway
NAME                   TYPE           CLUSTER-IP      EXTERNAL-IP   PORT(S)                                                                      AGE
istio-ingressgateway   LoadBalancer   10.152.183.64   <pending>     15021:31281/TCP,80:30341/TCP,443:32355/TCP,31400:31126/TCP,15443:30225/TCP   10m
$ curl localhost:30341/
335: 4087670249.93
5. Experiment
We use k6 for load testing.
import http from 'k6/http';
import { check, sleep } from 'k6';

export const options = {
    stages: [
        { duration: '1m', target: 30 },
        { duration: '1m', target: 100 },
        { duration: '3m', target: 200 },
        { duration: '1m', target: 300 },
        { duration: '2m', target: 100 },
        { duration: '2m', target: 20 },
    ]
}

export default function () {
  const url = __ENV.URL || 'http://localhost:8080/';
  const res = http.get(url);
  check(res, {
    'status was 200': (r) => r.status == 200,
  })
  sleep(1);
}
Let's start the load test. Please configure the URL appropriately.
k6 run -e URL="http://localhost:30341" --vus 100 --duration 5m ./loadtest.js
Watch for HPA changes in another terminal window.
$ kubectl -n demo get hpa -w
[I] ryo@zen ➜  part3 git:(feat/istio) kubectl -n demo get hpa -w
NAME               REFERENCE                     TARGETS                              MINPODS   MAXPODS   REPLICAS   AGE
go-cpu-intensive   Deployment/go-cpu-intensive   <unknown>/50 (avg), <unknown>/300m   1         10        0          13s
go-cpu-intensive   Deployment/go-cpu-intensive   <unknown>/50 (avg), <unknown>/300m   1         10        1          15s
go-cpu-intensive   Deployment/go-cpu-intensive   5749m/50 (avg), 4478m/300m           1         10        1          75s
go-cpu-intensive   Deployment/go-cpu-intensive   1462m/50 (avg), 4546m/300m           1         10        5          90s
go-cpu-intensive   Deployment/go-cpu-intensive   1278m/50 (avg), 457m/300m            1         10        10         105s
go-cpu-intensive   Deployment/go-cpu-intensive   1621m/50 (avg), 35m/300m             1         10        10         2m
go-cpu-intensive   Deployment/go-cpu-intensive   2433m/50 (avg), 39m/300m             1         10        10         2m15s
go-cpu-intensive   Deployment/go-cpu-intensive   2921m/50 (avg), 38m/300m             1         10        10         2m30s
go-cpu-intensive   Deployment/go-cpu-intensive   3405m/50 (avg), 38m/300m             1         10        10         2m46s
go-cpu-intensive   Deployment/go-cpu-intensive   18856m/50 (avg), 71m/300m            1         10        2          3m1s
go-cpu-intensive   Deployment/go-cpu-intensive   20219m/50 (avg), 885m/300m           1         10        2          3m16s
go-cpu-intensive   Deployment/go-cpu-intensive   7299m/50 (avg), 885m/300m            1         10        6          3m31s
go-cpu-intensive   Deployment/go-cpu-intensive   4593m/50 (avg), 384m/300m            1         10        10         3m46s
go-cpu-intensive   Deployment/go-cpu-intensive   5157m/50 (avg), 38m/300m             1         10        10         4m1s
go-cpu-intensive   Deployment/go-cpu-intensive   5884m/50 (avg), 39m/300m             1         10        10         4m16s
go-cpu-intensive   Deployment/go-cpu-intensive   6366m/50 (avg), 39m/300m             1         10        10         4m31s
go-cpu-intensive   Deployment/go-cpu-intensive   6856m/50 (avg), 39m/300m             1         10        10         4m46s
go-cpu-intensive   Deployment/go-cpu-intensive   36146m/50 (avg), 41m/300m            1         10        2          5m1s
go-cpu-intensive   Deployment/go-cpu-intensive   37358m/50 (avg), 775m/300m           1         10        2          5m16s
go-cpu-intensive   Deployment/go-cpu-intensive   12748m/50 (avg), 714m/300m           1         10        6          5m31s
go-cpu-intensive   Deployment/go-cpu-intensive   7509m/50 (avg), 47m/300m             1         10        10         5m46s
go-cpu-intensive   Deployment/go-cpu-intensive   7334m/50 (avg), 39m/300m             1         10        10         6m1s
go-cpu-intensive   Deployment/go-cpu-intensive   7166m/50 (avg), 39m/300m             1         10        10         6m16s
The results were interesting.
Apparently, increasing to 10 replicas satisfies the target value by a very good margin, so after a scale-in interval of 60 seconds (as we configured), the number of replicas is reduced to 2, but then it becomes too much larger than the target value.
It then tries 6 replicas, but the randomness of the workload itself seems to have a large effect, increasing the number of replicas to 10, and this seems to be repeated.
In fact, we had set a latency of 90%ile as the HPA target, but in this workload, rather than the impact of the increased number of requests slowing things down, we are running the loop a random number of times, and we suspect that the 90%ile has a large impact on that randomness.
This workload turned out hard for HPA to fit in.
Finally, we describe the HPA and confirm that the change in the number of replicas came from these metric values.
[I] ryo@zen ➜  part3 git:(feat/istio) k -n demo describe hpa/go-cpu-intensive
Name:                                                                              go-cpu-intensive
Namespace:                                                                         demo
... (omitted) ...
Events:
  Type    Reason             Age                   From                       Message
  ----    ------             ----                  ----                       -------
  Normal  SuccessfulRescale  5m13s                 horizontal-pod-autoscaler  New size: 5; reason: Deployment metric request_duration_seconds_90ile above target
  Normal  SuccessfulRescale  102s (x2 over 3m42s)  horizontal-pod-autoscaler  New size: 2; reason: All metrics below target
  Normal  SuccessfulRescale  72s (x2 over 3m12s)   horizontal-pod-autoscaler  New size: 6; reason: Deployment metric request_duration_seconds_90ile above target
  Normal  SuccessfulRescale  57s (x3 over 4m58s)   horizontal-pod-autoscaler  New size: 10; reason: Deployment metric request_duration_seconds_90ile above target
From the Events section, we confirmed that the scale-out were triggered by request_duration_seconds_90ile metric.
6. Clean-Up
kubectl delete -f istio-gateway.yml
kubectl delete -f go-cpu-intensive.yml
helmfile destroy
istioctl uninstall --purge -y
kubectl delete ns monitoring istio-system
Summary
In this post we worked on Kubernetes HPA with Custom Metrics. We configured Prometheus Adapter to make the metrics retrieved by Istio accessible from Kubernetes' Custom Metircs API. The workload we tried did not perform very well with the HPA parameters we set, but a normal workload that is not so random should behave more as expected.
Please also check GitHub for a Grafana dashboard integration.
References
- GitHub Link for this post
- Udemy: Istio Hands-On for Kubernetes (highly recommended)