
以前の記事で、KubernetesのHorizontal Pod Autoscaler (HPA) のデモを行いました。 その記事ではCPU利用率を対象にオートスケーリングを設定していましたが、今回は当該Podのリクエスト処理時間をHPAのターゲットに設定します。 アプリケーション側でメトリクス値を管理するのは手間なので、リクエスト処理時間のメトリクスはサービスメッシュIstioから取得することにします。
全体像
Stefan ProdanによるMedium記事に非常に分かりやすい図があったので掲載させていただきます。
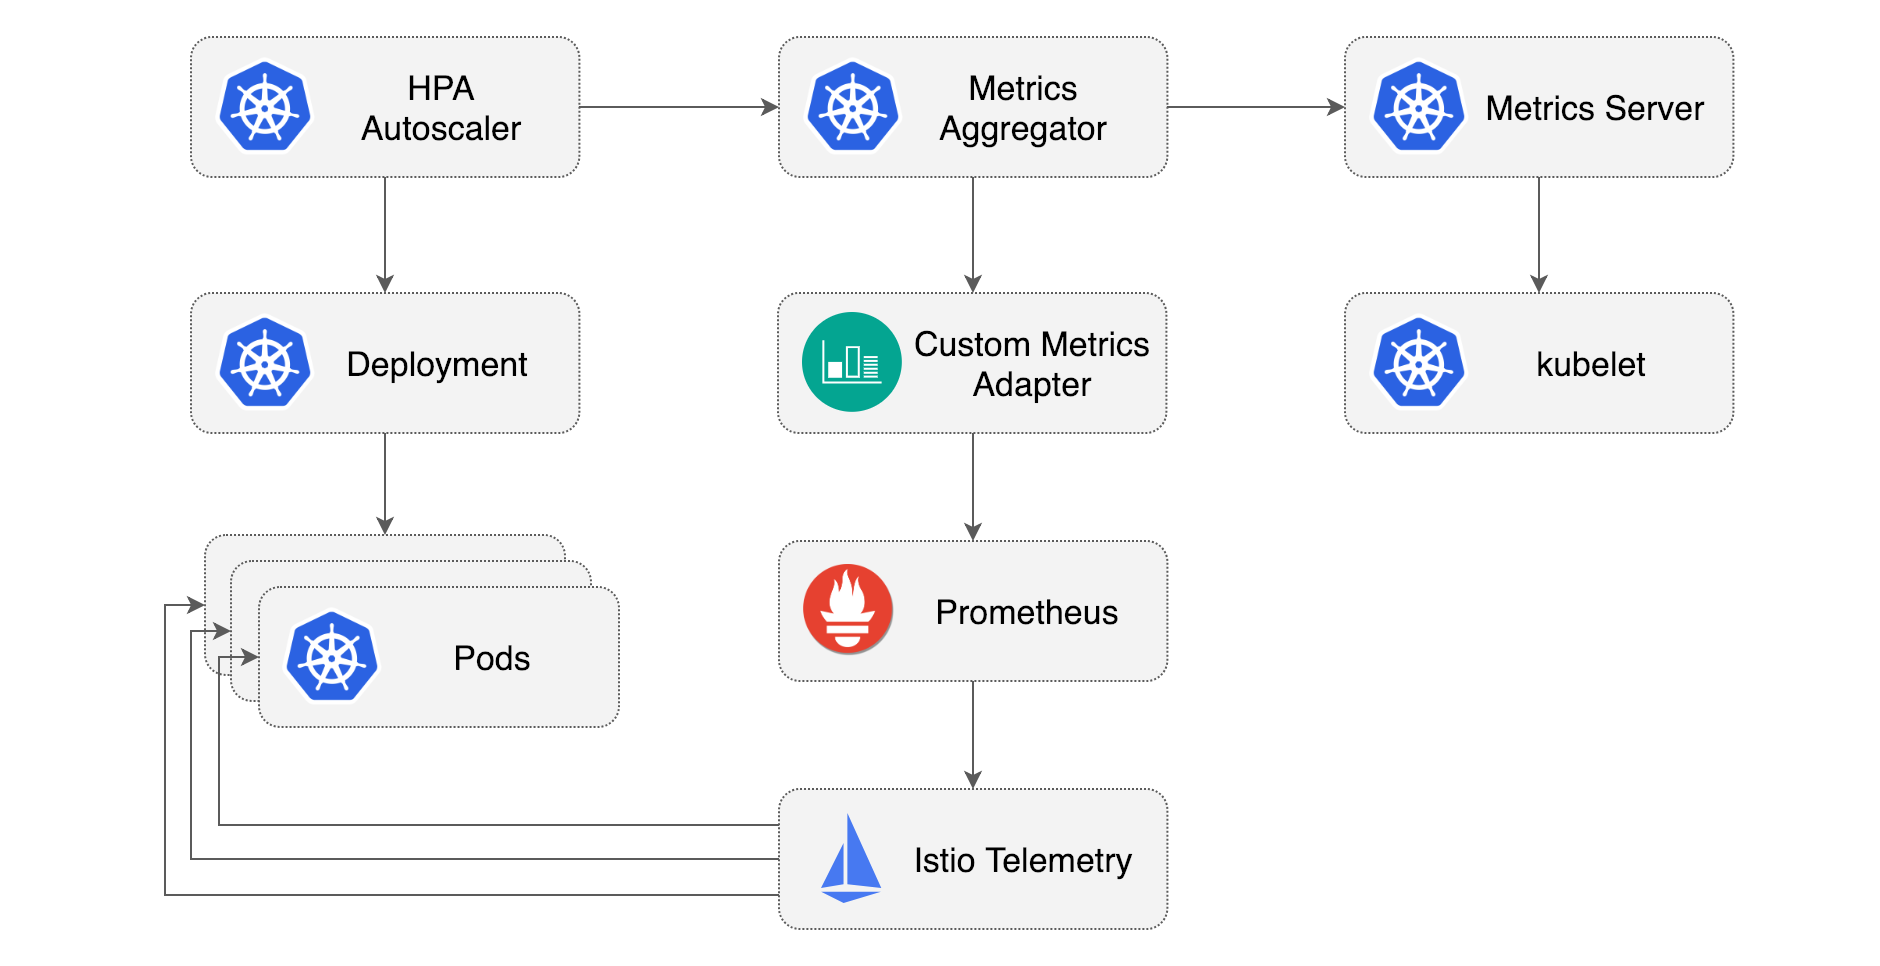
以前の記事で設定したCPUメトリクスによるHPAは、右上のMetrics Serverからメトリクス値を取得していました。 ただ、Metrics ServerはREADMEに書いてあるとおり
- CPUやメモリ利用率に対するHPA
- VPA (vertical pod autoscaling)
にしか利用できません。 そこで本記事ではPrometheus経由でIstioから取得したメトリクスを、Prometheus Adapterを通してKubernetes Custom Metrics APIに登録し、HPAのターゲットメトリクスとして利用します。
ワークロードとアーキテクチャ
ワークロードとして、前回の記事でも利用したGoアプリケーションを用います(GitHub・DockerHub)。
GET /リクエストに対してランダムな回数sqrtを行い、結果を返すという単純なプログラムです。
Kubernetesアーキテクチャは以下のとおりです。 ワークロードは一つなのでIstioを導入するのはオーバーキルに見えますが、実際には大規模なKubernetesクラスタの一部だと考えていただければと思います。

1. IstioおよびTelemetry Addonsのデプロイ
Istioctl を利用して Istio をデプロイします。
istioctl install --set profile=demo -y
次に、istio/istioをcloneし、READMEにしたがってIstioのTelemetry Addonsをデプロイします。
git clone https://github.com/istio/istio.git
cp -r istio/samples/addons .
rm -rf istio
kubectl apply -f addons/
Prometheusなどがistio-system namespaceにデプロイされたことを、こちらのコマンドで確認してください。
kubectl -n istio-system get all
2. Prometheus Adapterのデプロイ
Helmでデプロイ可能ですが、デプロイ時に登録するメトリクスをバージョン管理したいので、helmfileを利用します。 インストール方法はこちらをご参照ください。
helmfile.yamlを作成します。
なお、.ymlにする場合は後述のhelmfile syncコマンドに-fでファイル名を指定する必要があります
repositories:
- name: prometheus-community
  url: https://prometheus-community.github.io/helm-charts

releases:
- name: prometheus-adapter
  namespace: monitoring
  chart: prometheus-community/prometheus-adapter
  version: 4.2.0
  values:
  - ./prometheus-adapter-values.yml
続いて prometheus-adapter-values.ymlを作成します:
prometheus:
  url: http://prometheus.istio-system.svc.cluster.local
  port: 9090

rules:
  custom:
  - seriesQuery: 'istio_requests_total{reporter="destination", destination_service_namespace="demo", destination_service_name="go-cpu-intensive"}'
    resources:
      overrides:
        destination_service_namespace:
          resource: "namespace"
        destination_service_name:
          resource: "service"
    name:
      as: "requests_per_second"
    metricsQuery: 'sum(rate(<<.Series>>{<<.LabelMatchers>>, reporter="destination"}[5m])) by (<<.GroupBy>>)'

  - seriesQuery: 'istio_request_duration_milliseconds_bucket{reporter="destination", destination_workload_namespace="demo", destination_workload="go-cpu-intensive"}'
    resources:
      overrides:
        destination_workload_namespace:
          resource: "namespace"
        destination_workload:
          resource: "deployment"
    name:
      as: "request_duration_seconds_90ile"
    metricsQuery: 'sum(histogram_quantile(0.90, sum(irate(<<.Series>>{<<.LabelMatchers>>, reporter="destination"}[5m])) by (le,<<.GroupBy>>))) by (<<.GroupBy>>) / 1000'
-
prometheus: このセクションでは Prometheus の設定を指定します。- Istio AddonsとしてデプロイしたPrometheusはデフォルトで
istio-systemnamespaceで稼働しているため、こちらのURLを設定しています。
- Istio AddonsとしてデプロイしたPrometheusはデフォルトで
-
rules.custom: Kubernetesのカスタム・メトリクスAPI (custom.metrics.k8s.io)にエクスポートするメトリクスの一覧を設定します。
1つ目のメトリクスについて説明します。
seriesQuery: 新しいメトリックを生成するために使用される時系列を選択するためのクエリです。時系列はラベルでフ�ィルタリングされます。resources: ここではクエリラベルのdestination_service_namespaceをKubernetesのnamespaceに、destination_service_nameをserviceにマッピングしています。name: メトリックの新しい名前をrequests_per_secondと指定しています。metricsQuery: 選択した時系列から新しいメトリックを計算する方法を指定します。- このケースでは
istio_requests_totalメトリックの過去5分間の1秒あたりのレートの合計を、指定したラベルでグループ化して計算しています。 LabelMatchersはresourcesの中身(destination_service_namespace="demo",destination_service_name="go-cpu-intensive)に、GroupByはdestination_service_namespace,destination_service_nameになります(参考)。
- このケースでは
2つ目のメトリクスも同様ですが、今回はSereviceではなくDeploymentに紐付けることにします。
それでは、Prometheus Adapterをデプロイします:
helmfile sync
デフォルトでhelmfile.yamlを読み込むので、これでデプロイできるはずです。
3. HPAの設定
続いて、ワークロードのDeployment, Service, HPAを設定します。
Istioのサイドカー・インジェクションを利用するために、demo namespaceに対してistio-injection=enabledというラベルを付与しておきます。
apiVersion: v1
kind: Namespace
metadata:
  name: demo
  labels:
    istio-injection: enabled
---
apiVersion: v1
kind: Service
metadata:
  name: go-cpu-intensive
  namespace: demo
  labels:
    app: go-cpu-intensive
spec:
  type: ClusterIP
  selector:
    app: go-cpu-intensive
  ports:
  - port: 80
    targetPort: 8080
---
apiVersion: apps/v1
kind: Deployment
metadata:
  name: go-cpu-intensive
  namespace: demo
  labels:
    app: go-cpu-intensive
spec:
  replicas: 1
  selector:
    matchLabels:
      app: go-cpu-intensive
  template:
    metadata:
      labels:
        app: go-cpu-intensive
    spec:
      containers:
      - name: go-cpu-intensive
        image: ryojpn/go-cpu-intensive
        resources:
          limits:
            cpu: 500m
            memory: 128Mi
          requests:
            cpu: 500m
            memory: 128Mi
        ports:
        - containerPort: 8080
---
apiVersion: autoscaling/v2
kind: HorizontalPodAutoscaler
metadata:
  name: go-cpu-intensive
  namespace: demo
spec:
  scaleTargetRef:
    apiVersion: apps/v1
    kind: Deployment
    name: go-cpu-intensive
  minReplicas: 1
  maxReplicas: 10
  behavior:
  scaleDown:
    stabilizationWindowSeconds: 60 # intentionally using a small value. default: 300
  metrics:
  - type: Object
    object:
      describedObject:
        apiVersion: v1
        kind: Service
        name: go-cpu-intensive
      metric:
        name: requests_per_second
      target:
        type: AverageValue # divide metric value by the number of pods
        averageValue: "50"
  - type: Object
    object:
      describedObject:
        apiVersion: apps/v1
        kind: Deployment
        name: go-cpu-intensive
      metric:
        name: request_duration_seconds_90ile
      target:
        type: Value
        value: 300m
Service, Deployment は特別なことはしていませんので、HPAについて簡単に説明します。
今回作成したカスタム・メトリクスはそれぞれService、Deploymentにマッピングしたので、metricsのtypeはObjectにし、describedObjectから対象を記述します。
target.typeについて、requests_per_podはPodあたりの値で平均したいのでAverageValueにしています。
またrequest_duration_seconds_90ileのvalueは300mとしていますが、"0.3"(string型)と同じです。
ではデプロイしておきましょう:
kubectl apply -f go-cpu-intensive.yml
4. Istio Ingress Gatewayの設定
Istioを利用してメトリクスを収集するためには、インターネットからのリクエストをまずIngress Gatewayで受け付ける必要があります。
そこで以下のマニフェストでGatewayとVirtualServiceを生成します。
apiVersion: networking.istio.io/v1beta1
kind: Gateway
metadata:
  namespace: demo
  name: demo-gateway
spec:
  selector:
    istio: ingressgateway # use istio default controller
  servers:
  - port:
      number: 80
      name: http
      protocol: HTTP
    hosts:
    - '*'
---
apiVersion: networking.istio.io/v1beta1
kind: VirtualService
metadata:
  namespace: demo
  name: istio-ingress-vs
spec:
  hosts:
    - '*'
  gateways:
    - demo-gateway
  http:
    - route:
        - destination:
            host: go-cpu-intensive.demo.svc.cluster.local
            port:
              number: 80
デプロイしましょう:
kubectl apply -f istio-gateway.yml
私の環境(MicroK8s)では、IstioのIngress Gateway はExternal IPが割り当てられず、ポート80番はlocalhost:30341にマップされていることが分かります:
$ kubectl -n istio-system get svc/istio-ingressgateway
NAME                   TYPE           CLUSTER-IP      EXTERNAL-IP   PORT(S)                                                                      AGE
istio-ingressgateway   LoadBalancer   10.152.183.64   <pending>     15021:31281/TCP,80:30341/TCP,443:32355/TCP,31400:31126/TCP,15443:30225/TCP   10m
$ curl localhost:30341/
335: 4087670249.93
5. 実験
負荷試験にはk6を用います。
import http from 'k6/http';
import { check, sleep } from 'k6';

export const options = {
    stages: [
        { duration: '1m', target: 30 },
        { duration: '1m', target: 100 },
        { duration: '3m', target: 200 },
        { duration: '1m', target: 300 },
        { duration: '2m', target: 100 },
        { duration: '2m', target: 20 },
    ]
}

export default function () {
  const url = __ENV.URL || 'http://localhost:8080/';
  const res = http.get(url);
  check(res, {
    'status was 200': (r) => r.status == 200,
  })
  sleep(1);
}
それでは負荷試験を行います。URLの部分は環境に合わせて修正してください。
k6 run -e URL="http://localhost:30341" --vus 100 --duration 5m ./loadtest.js
別のターミナル・ウィンドウで、HPAをwatchしておきます。
$ kubectl -n demo get hpa -w
[I] ryo@zen ➜  part3 git:(feat/istio) kubectl -n demo get hpa -w
NAME               REFERENCE                     TARGETS                              MINPODS   MAXPODS   REPLICAS   AGE
go-cpu-intensive   Deployment/go-cpu-intensive   <unknown>/50 (avg), <unknown>/300m   1         10        0          13s
go-cpu-intensive   Deployment/go-cpu-intensive   <unknown>/50 (avg), <unknown>/300m   1         10        1          15s
go-cpu-intensive   Deployment/go-cpu-intensive   5749m/50 (avg), 4478m/300m           1         10        1          75s
go-cpu-intensive   Deployment/go-cpu-intensive   1462m/50 (avg), 4546m/300m           1         10        5          90s
go-cpu-intensive   Deployment/go-cpu-intensive   1278m/50 (avg), 457m/300m            1         10        10         105s
go-cpu-intensive   Deployment/go-cpu-intensive   1621m/50 (avg), 35m/300m             1         10        10         2m
go-cpu-intensive   Deployment/go-cpu-intensive   2433m/50 (avg), 39m/300m             1         10        10         2m15s
go-cpu-intensive   Deployment/go-cpu-intensive   2921m/50 (avg), 38m/300m             1         10        10         2m30s
go-cpu-intensive   Deployment/go-cpu-intensive   3405m/50 (avg), 38m/300m             1         10        10         2m46s
go-cpu-intensive   Deployment/go-cpu-intensive   18856m/50 (avg), 71m/300m            1         10        2          3m1s
go-cpu-intensive   Deployment/go-cpu-intensive   20219m/50 (avg), 885m/300m           1         10        2          3m16s
go-cpu-intensive   Deployment/go-cpu-intensive   7299m/50 (avg), 885m/300m            1         10        6          3m31s
go-cpu-intensive   Deployment/go-cpu-intensive   4593m/50 (avg), 384m/300m            1         10        10         3m46s
go-cpu-intensive   Deployment/go-cpu-intensive   5157m/50 (avg), 38m/300m             1         10        10         4m1s
go-cpu-intensive   Deployment/go-cpu-intensive   5884m/50 (avg), 39m/300m             1         10        10         4m16s
go-cpu-intensive   Deployment/go-cpu-intensive   6366m/50 (avg), 39m/300m             1         10        10         4m31s
go-cpu-intensive   Deployment/go-cpu-intensive   6856m/50 (avg), 39m/300m             1         10        10         4m46s
go-cpu-intensive   Deployment/go-cpu-intensive   36146m/50 (avg), 41m/300m            1         10        2          5m1s
go-cpu-intensive   Deployment/go-cpu-intensive   37358m/50 (avg), 775m/300m           1         10        2          5m16s
go-cpu-intensive   Deployment/go-cpu-intensive   12748m/50 (avg), 714m/300m           1         10        6          5m31s
go-cpu-intensive   Deployment/go-cpu-intensive   7509m/50 (avg), 47m/300m             1         10        10         5m46s
go-cpu-intensive   Deployment/go-cpu-intensive   7334m/50 (avg), 39m/300m             1         10        10         6m1s
go-cpu-intensive   Deployment/go-cpu-intensive   7166m/50 (avg), 39m/300m             1         10        10         6m16s
興味深い結果が得られました。
どうやら10レプリカまで増やすとターゲット値を余裕で満たしてしまうので、60秒として設定したスケールイン・インターバルののちレプリカ数を2まで減らしますが、そうするとターゲット値より大きくなりすぎてしまいます。
そこで、6レプリカを試みますが、ワークロード自体のランダム性の影響が大きいのか、レプリカ数を10まで増やしてしまい、これが繰り返されているようです。
実際、HPAのターゲットとして90%ileのレイテンシを設定していましたが、今回のワークロードではリクエスト数が増えたらその分遅くなる、という影響よりも、そもそもランダムな回数ループを回しているので、その分が90%ileだと大きく影響していると推察されます。
今回のワークロードで、このHPAのパラメータではうまく調整できない結果となりました。
最後に、HPAをdescribeし、リプリカ数の変更がこれらのメトリクス値に由来していることを確認します。
[I] ryo@zen ➜  part3 git:(feat/istio) k -n demo describe hpa/go-cpu-intensive
Name:                                                                              go-cpu-intensive
Namespace:                                                                         demo
... (omitted) ...
Events:
  Type    Reason             Age                   From                       Message
  ----    ------             ----                  ----                       -------
  Normal  SuccessfulRescale  5m13s                 horizontal-pod-autoscaler  New size: 5; reason: Deployment metric request_duration_seconds_90ile above target
  Normal  SuccessfulRescale  102s (x2 over 3m42s)  horizontal-pod-autoscaler  New size: 2; reason: All metrics below target
  Normal  SuccessfulRescale  72s (x2 over 3m12s)   horizontal-pod-autoscaler  New size: 6; reason: Deployment metric request_duration_seconds_90ile above target
  Normal  SuccessfulRescale  57s (x3 over 4m58s)   horizontal-pod-autoscaler  New size: 10; reason: Deployment metric request_duration_seconds_90ile above target
request_duration_seconds_90ileメトリックによってスケールアウトされていることが確認できました。
6. クリーンアップ
kubectl delete -f istio-gateway.yml
kubectl delete -f go-cpu-intensive.yml
helmfile destroy
istioctl uninstall --purge -y
kubectl delete ns monitoring istio-system
まとめ
今回はカスタム・メトリクスによるKubernetesのHPAに取り組みました。 Istioが取得したメトリクスをPrometheus, Prometheus Adapter経由でKubernetesのCustom Metircs APIからアクセスできるようにしました。 ワークロード自体、今回設定したHPAパラメータとの相性が悪く、あまり期待通りの結果にはなりませんでしたが、ランダム性がそれほど高くない通常のワークロードであれば、より期待通りに動作するはずです。
またGitHubではGrafanaダッシュボードの連携も行っていますので、合わせてご覧ください。
参考
- GitHub Link for this post
- Udemy: Istio Hands-On for Kubernetes (highly recommended)